|
| This is the 2.5 meter telescope used by the SDSS collaboration at the Apache Point Observatory. |
When you have in your pocket observations of the positions and colors of more than one million galaxies, there are a lot of questions about the universe that can be investigated. In this post, I will focus on explaining how we have measured the expansion of the universe from the distribution of galaxies of the BOSS survey, which is part of the Sloan Digital Sky Survey.
BOSS, the Baryon Oscillation Spectroscopic Survey, have targeted 1.35 million galaxies covering approximately 10,000 square degrees. Galaxies are observed by setting optical fibers in the focal plane of the telescope. The light of each galaxy is then carried to an spectrograph where it is diffracted into a spectrum (of wavelengths or frequencies, this is, colors) and the data is stored.
As the light travels from the galaxy where it was originally emitted to us, the spectrum of colors of the galaxies shifts towards the red. This is, the galaxies are seen reader than their original color. We call this change in color redshift, and we can measure it because we know the color/frequency of a particular atomic transition as it would have been observed in the galaxies when it was emitted. The amount in the color -the redshift- is an important cosmological quantity and tells us about how much the universe have changed in size since that light was emitted. If the universe have doubled its volume since then, then the wavelength of the light that we observe have doubled too.
Now, to know the expansion history of the universe we need to figure out how big the universe was at different times. To achieve this we could use different sets of galaxies. If for each set of galaxies we can determine how old was the universe when their emitted their light, and how big was the universe then, we have solve the problem. The first part, how big was the universe when the light of the galaxies was emitted, we have just obtained by using the redshift. The second part, which is how old was the universe when the light of the galaxies was emitted, is what we need to sort out next. In fact, we only need times differences. This is, we only need to know old was the universe when that light of each group of galaxies was emitted in comparison of how old the universe is now, which is the same as asking how long ago the light of each group of galaxies was emitted. And, since the light travels at a constant speed, this is equivalent to ask how far that group of galaxies is from us.
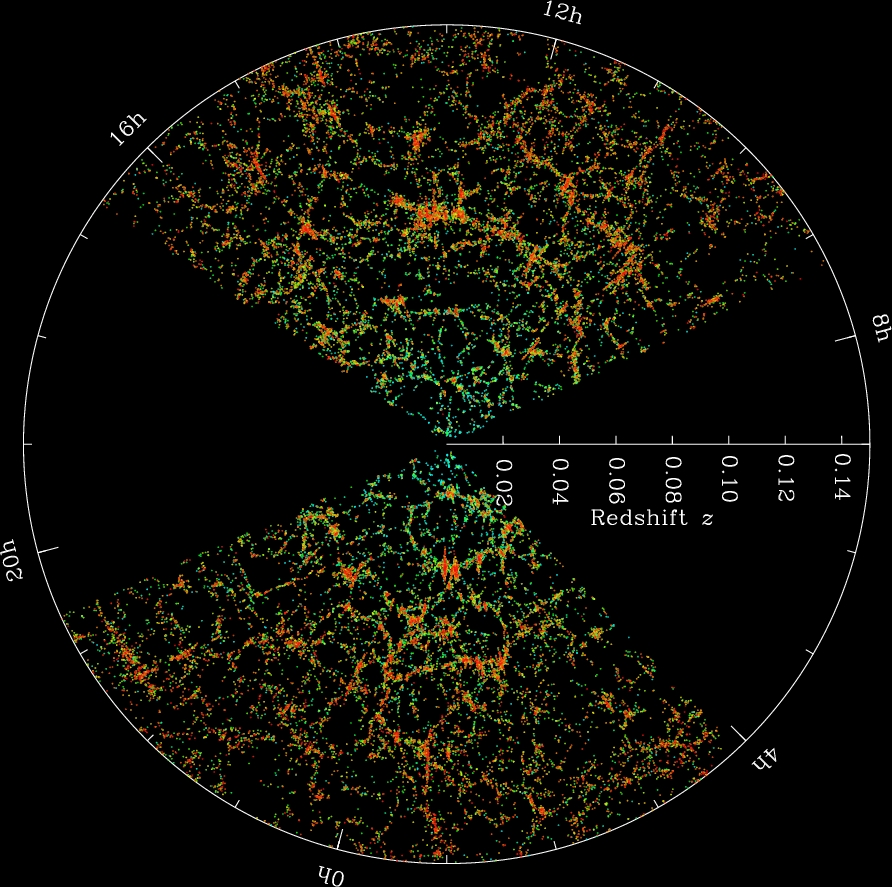 | ||||
| This is a map of some of the galaxies observed from the SDSS telescope. Courtesy of M Blanton and the Sloan Digital Sky Survey |
The Figure above show slices through the SDSS 3-dimensionalmap of the distribution of galaxies. Earth is at the center, each point represents a galaxy, typically containing about 100 billion stars. The outer circle is at a distance of 2 billion light years. The original distance between the edges is was not mapped by the SDSS because dust in our won Galaxy obscures the view of the distant universe in this directions. Both slices contain all galaxies between -1.25 and 1.25 degrees declination.
As it can be seen in the Figure above, galaxies in the universe are not distributed randomly. Galaxies tend to cluster in groups of galaxies because they attract each other. Galaxies also have a particular separation that they are more likely to be found as opposed to a little shorter or a little larger distances. This separation comes from plasma physics - it is the Baryon Acoustic Oscillation characteristic distance - and we know it is about 4,5 1021 km. This distance is not the distance between us and any set of galaxies, but a shorter one, the distance that galaxies "like" to be between themselves.
In the sky, this typical separation between galaxies appears as an angle. For each set of galaxies that we select as having emitted their light at a particular moment of the expansion of the universe, the typical separation of the galaxies between themselves appears to us as a given particular angle. Each set of galaxies have a particular angle that gives the typical separation of the galaxies between themselves. And, since we know the value of this separation between galaxies from physics, r, and the angle its subtends by observation, θ, using the basic geometry of a triangle, we can know the distance between us of these galaxies, d. This is shown in last figure.
 | ||
| This shows a person observing two galaxies separated a typical distance r, if we know the angle θ, we can measure the distance from us to the galaxies. |
In summary, to know about the expansion rate of the universe we select several samples of galaxies. Each sample have emitted its light at a different time, and therefore it is at a different distance to us. We can measure this distance from geometry by observing the typical angle at which galaxies are separated. Once we have the distance to each sample of galaxies, we have also a measure of how long ago they emitted that light. Now, from the colors of the galaxies (the redshift) we know also how big the universe was at that time. For each set of galaxies we know therefore the age of the universe at a particular moment and how big the universe was (in comparison to now). We have therefore determined the expansion of the universe.
This is what BOSS survey have done using three sets of galaxies at different distances.
You can read more here:
Lauren Anderson, Eric Aubourg, Stephen Bailey et al. (BOSS collaboration paper)
The clustering of galaxies in the SDSS-III Baryon Oscillation Spectroscopic Survey: Baryon Acoustic Oscillations in the Data Release 10 and 11 galaxy samples